APS visualization
Description:
Currently, within the main function of the Advanced Planning and Scheduling (APS) module in BEAS, users can only view and calculate Work Orders (WO) and positions independently. There is no standard functionality that allows for the independent visualization and calculation of subproducts or subfolders.
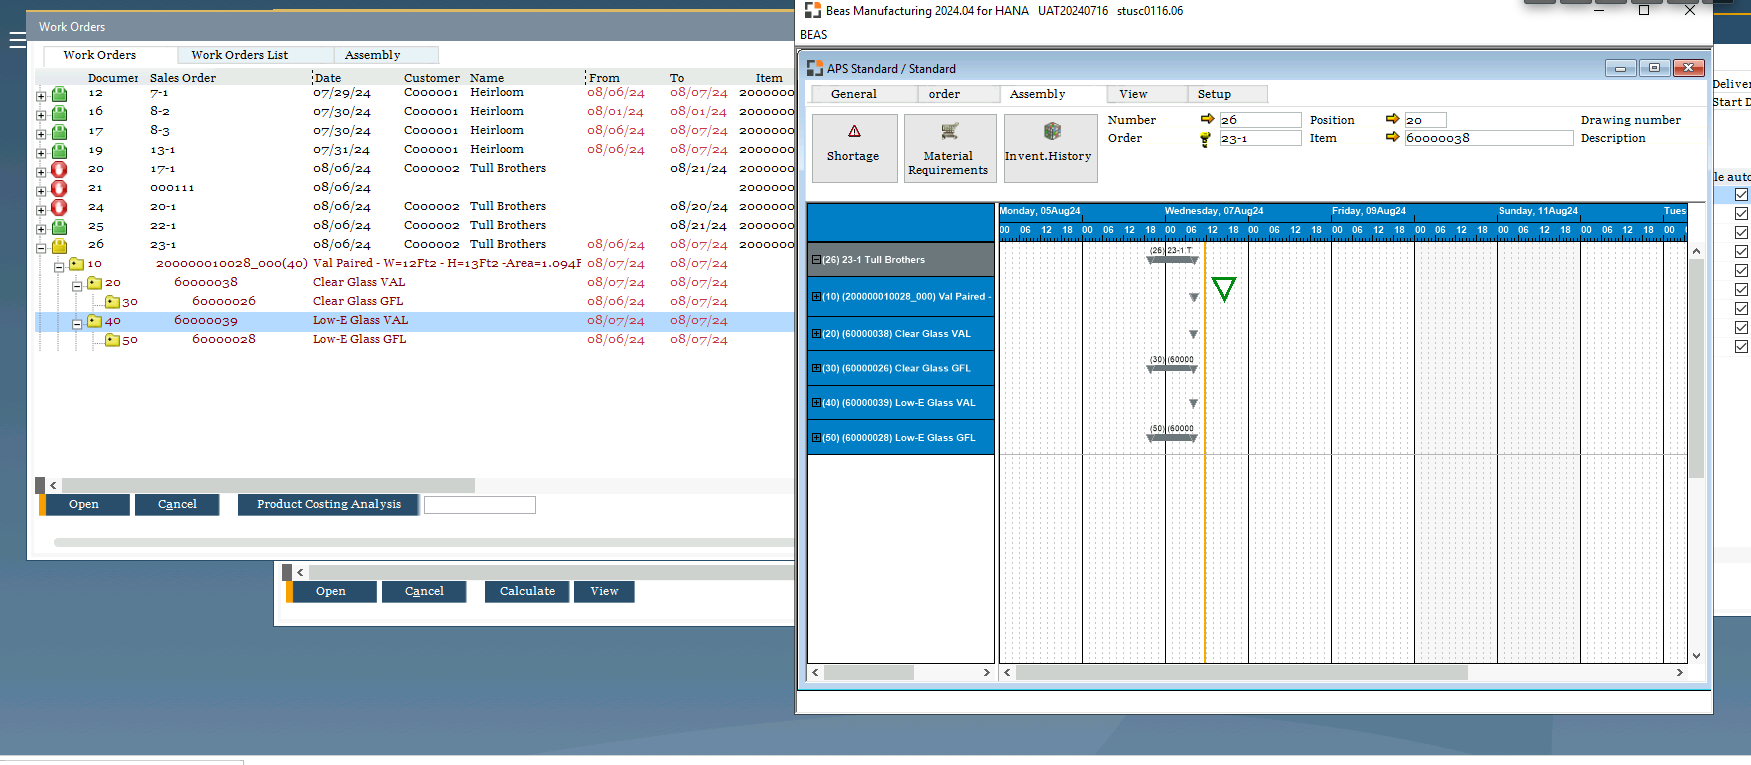
The only standard method to achieve this is through the Gantt chart. However, this option requires more detailed training for clients and is more complex to manage. Clients typically prefer to use the main APS view for visualization and operation.
There are other visualization methods, such as the Dispatch Report or Pool Report (if the subfolders have specific operations). However, these alternatives fall short as they are not user-friendly for subfolder visualization and are limited to showing only the WO and position.
Request:
We request consideration for the implementation of a feature that allows for the independent visualization and calculation of subproducts and subfolders directly from the main APS view. This would enable clients to use the system more easily without resorting to additional or complex tools.
Benefits:
- Improved user experience by simplifying the planning process.
- Reduced need for additional training to manage the Gantt chart.
- Increased operational efficiency by allowing more direct and straightforward management of subproducts and subfolders.
We appreciate your attention and hope that this enhancement can be considered for future updates.
APS: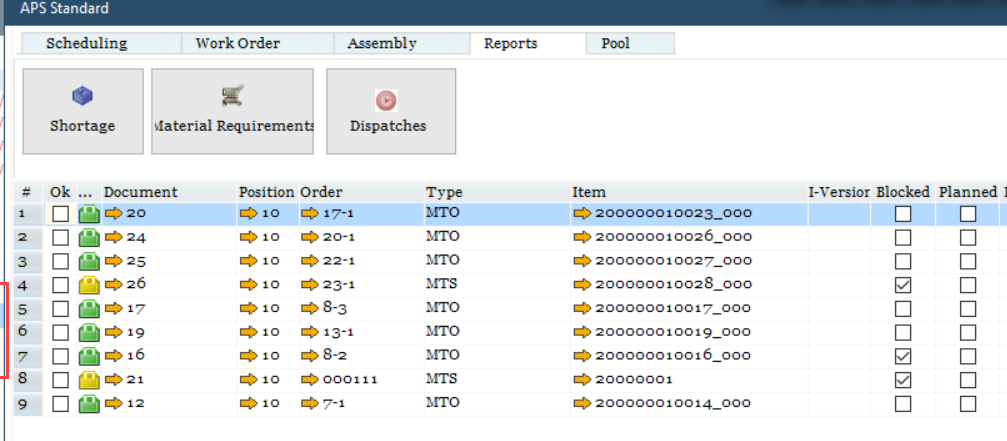
Gantt:
Comments
0 comments
Please sign in to leave a comment.